Applications
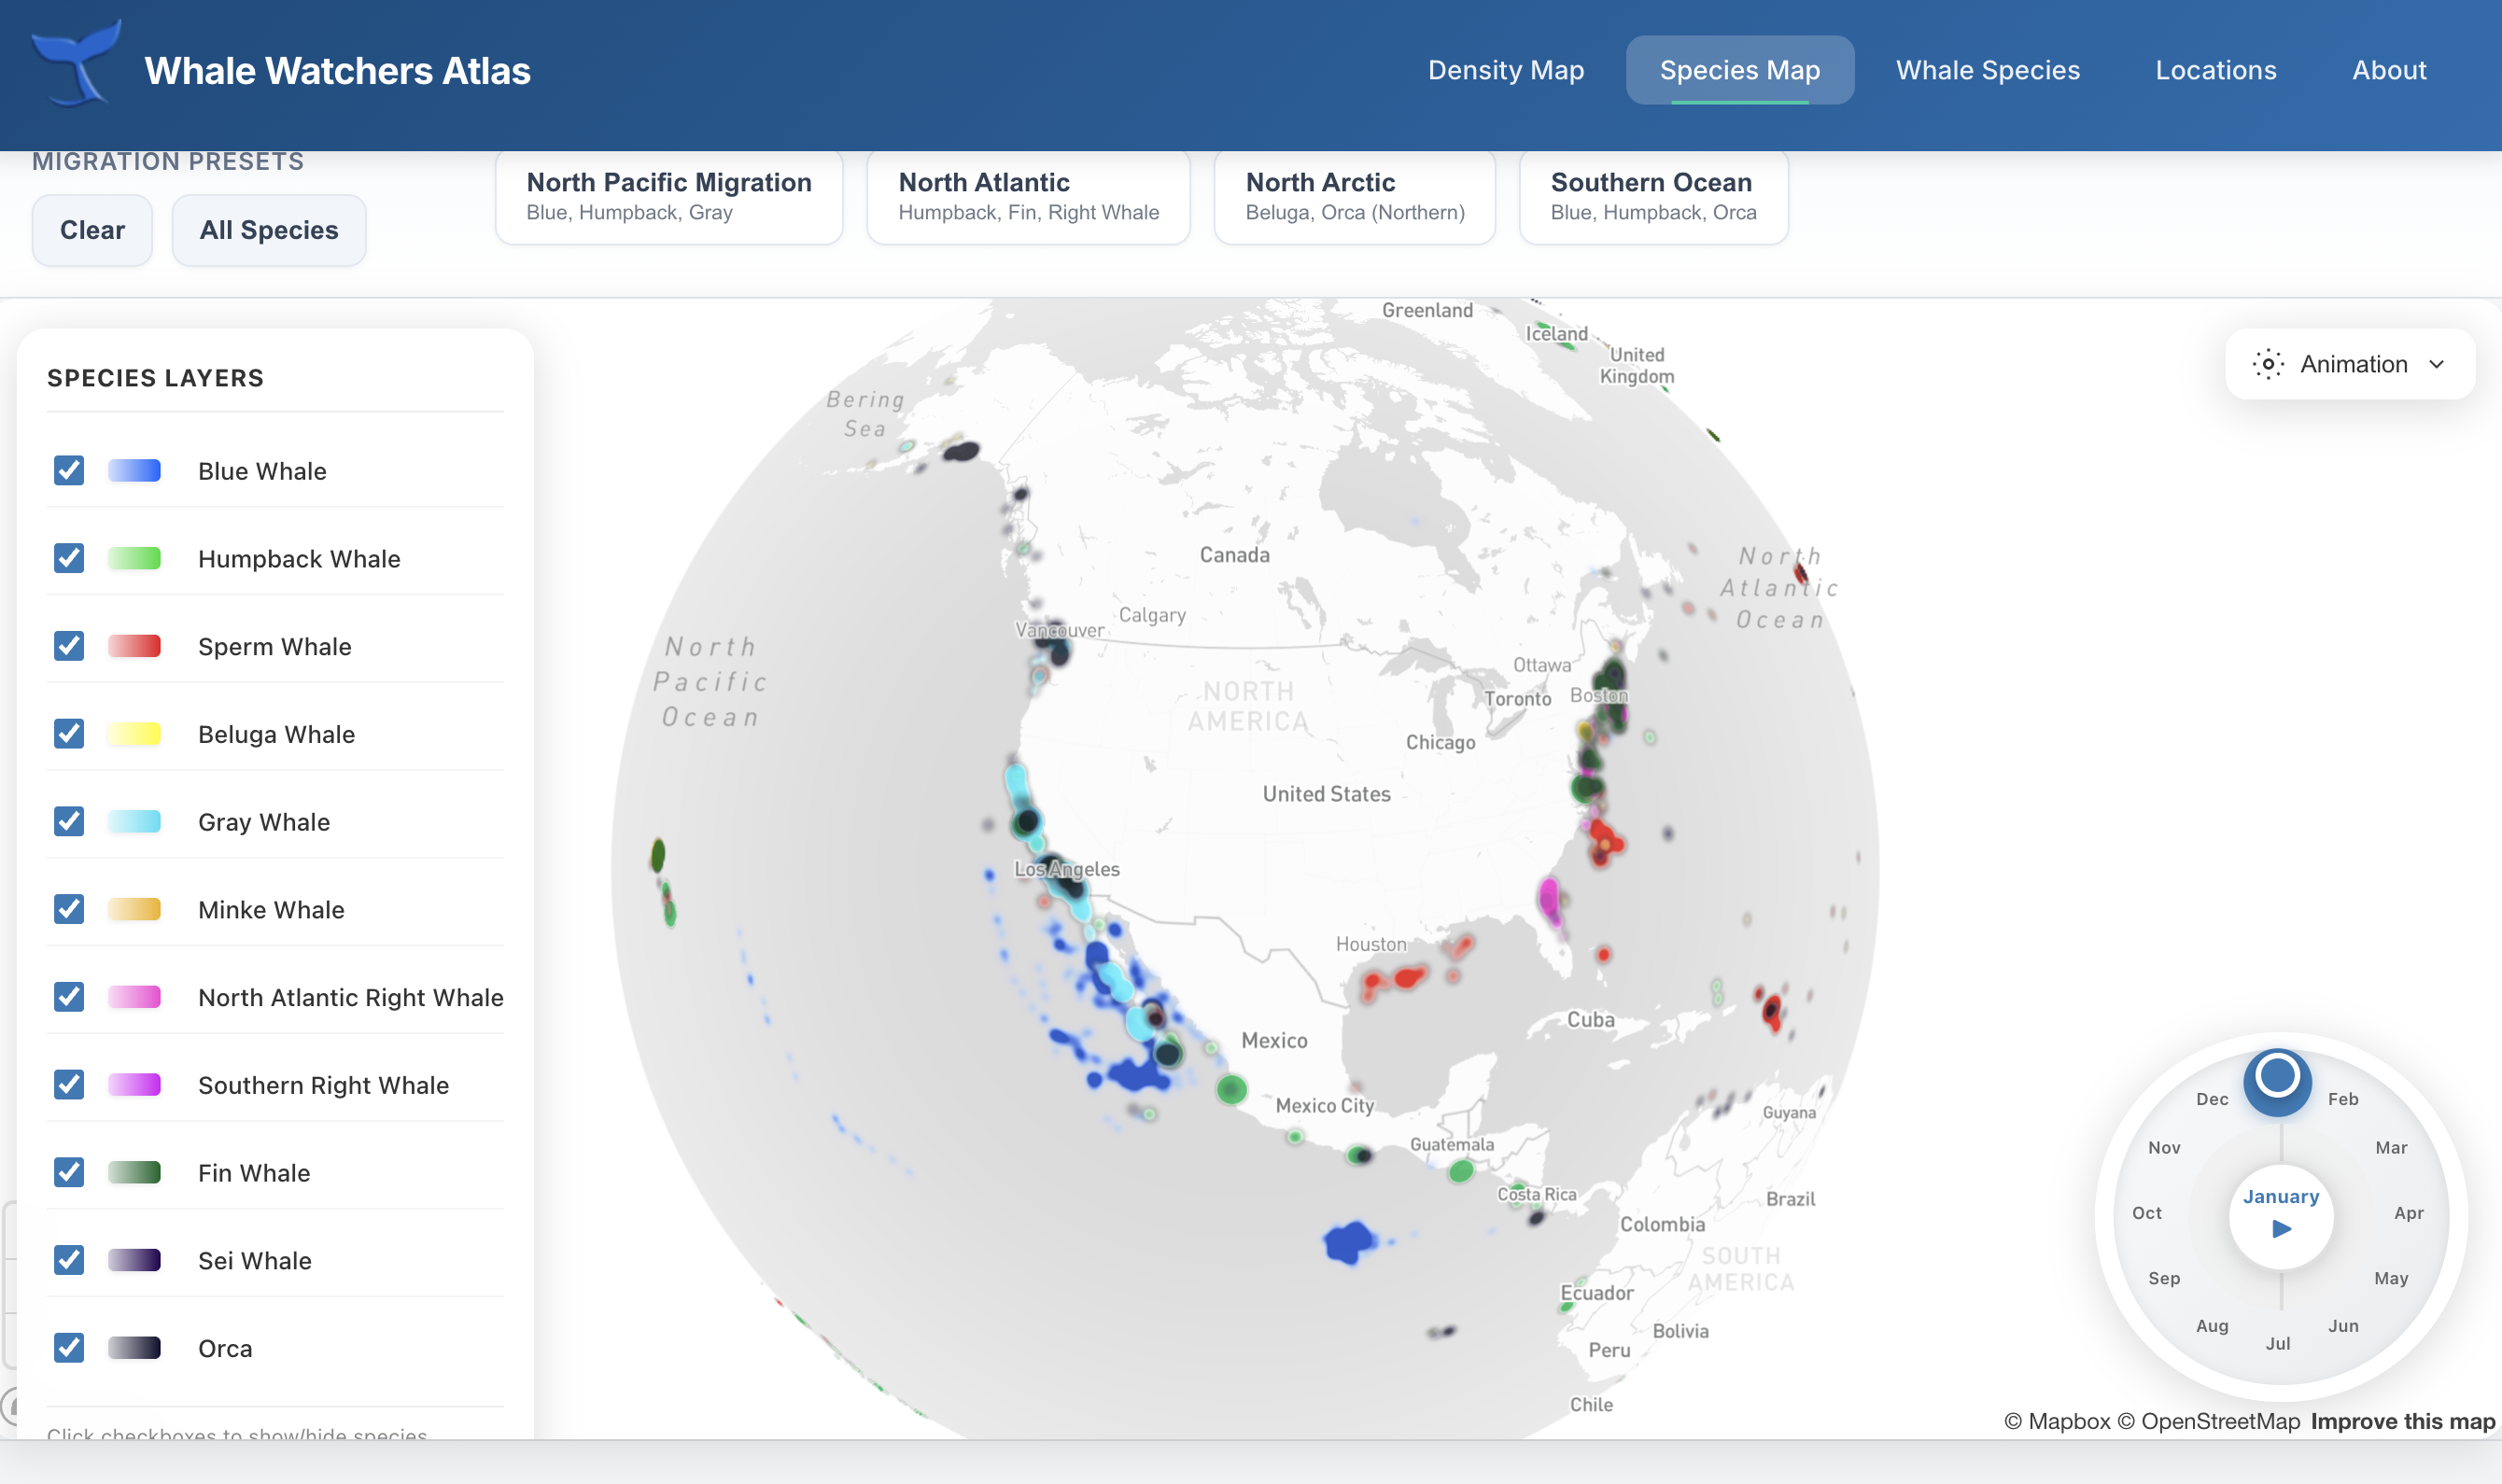
Whale Watchers Atlas
An interactive 3D globe visualization built with Globe.gl that tracks whale migration patterns across the world's oceans. Users can explore migration routes, seasonal movements, and population data for multiple whale species.
Visit Site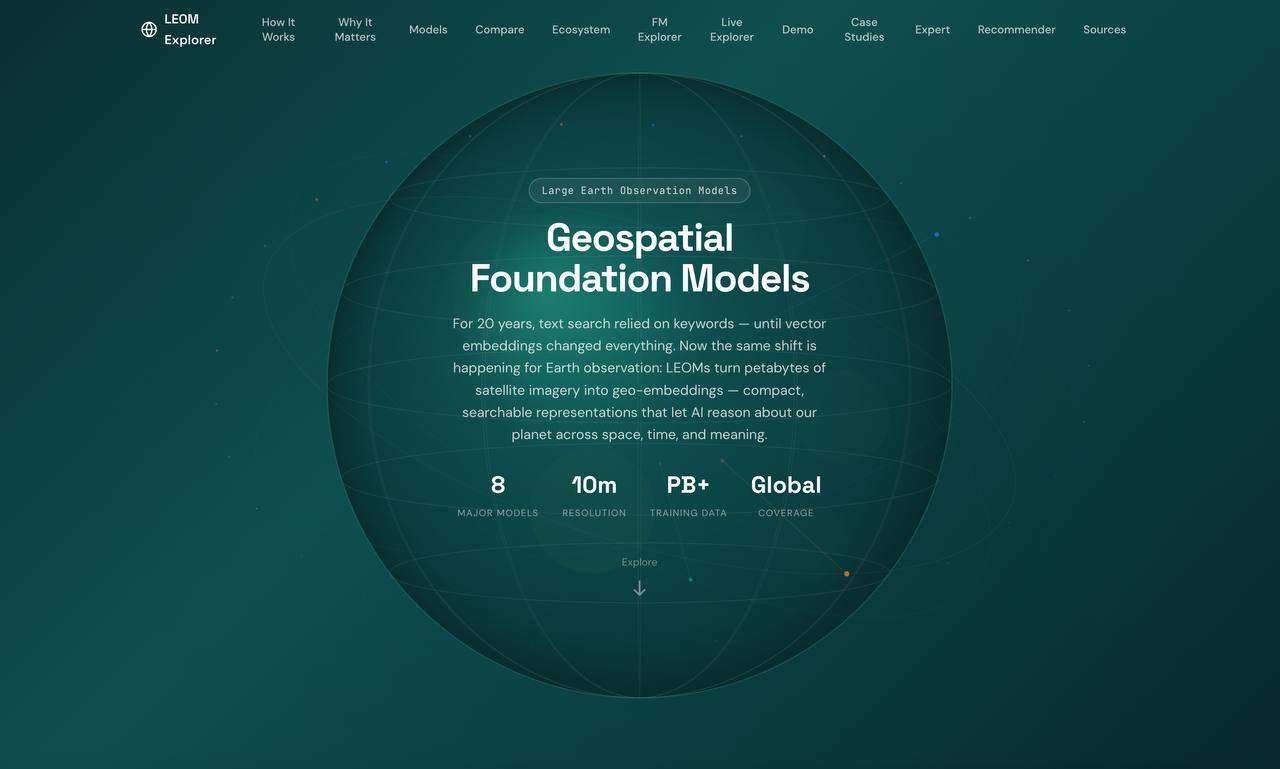
GeoFM Explorer
An educational platform exploring Large Earth Observation Models (LEOMs) — the foundation models trained on satellite imagery. Compare architectures, explore embedding dimensions, and understand how these models transform remote sensing.
Visit Site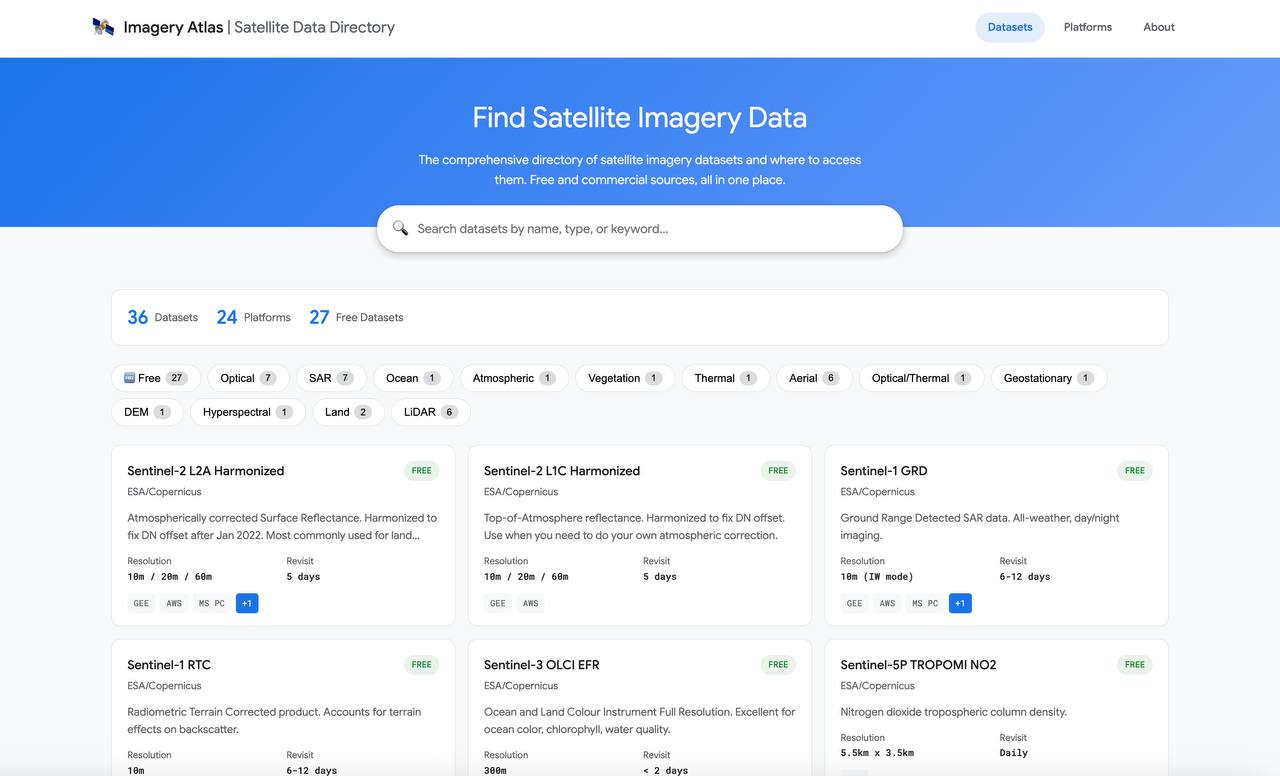
Imagery Atlas
A comprehensive directory of satellite imagery datasets, organized by sensor type, resolution, and coverage. Helps researchers quickly find the right data sources for their remote sensing projects.
Visit Site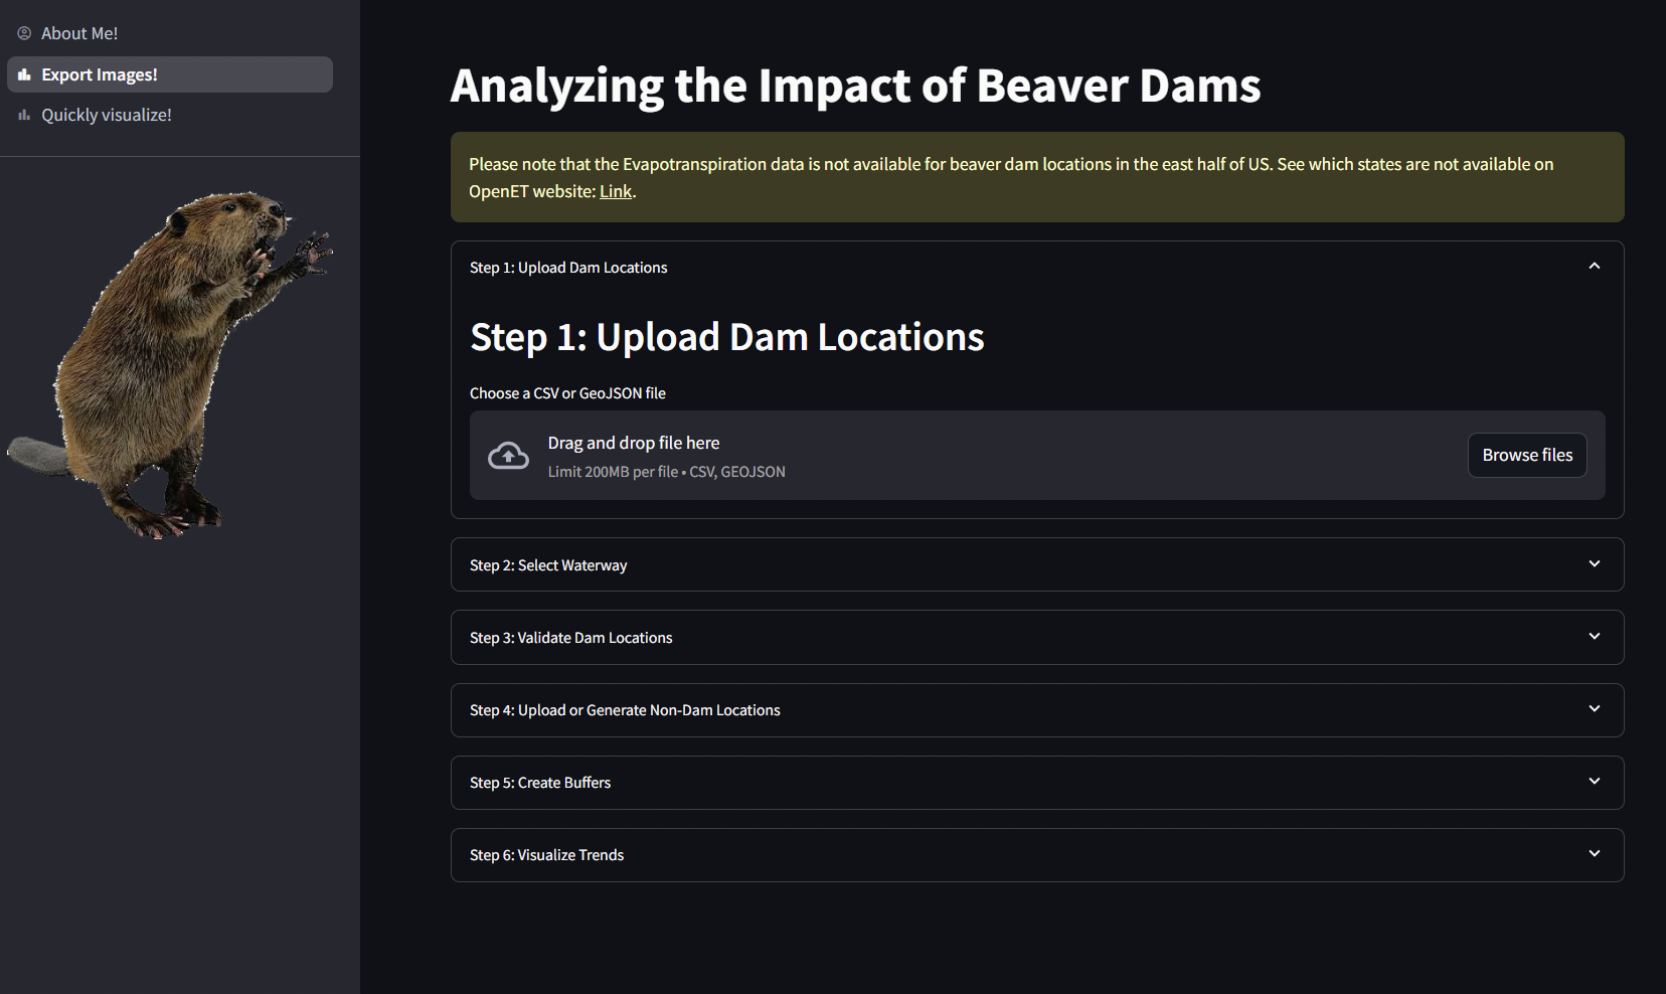
Beaver Impact Tool
A research platform developed with Collaborative Earth to analyze the ecological impact of beaver activity on watershed restoration. Uses remote sensing to identify beaver dam locations and model their effects on water retention and vegetation.
Visit Site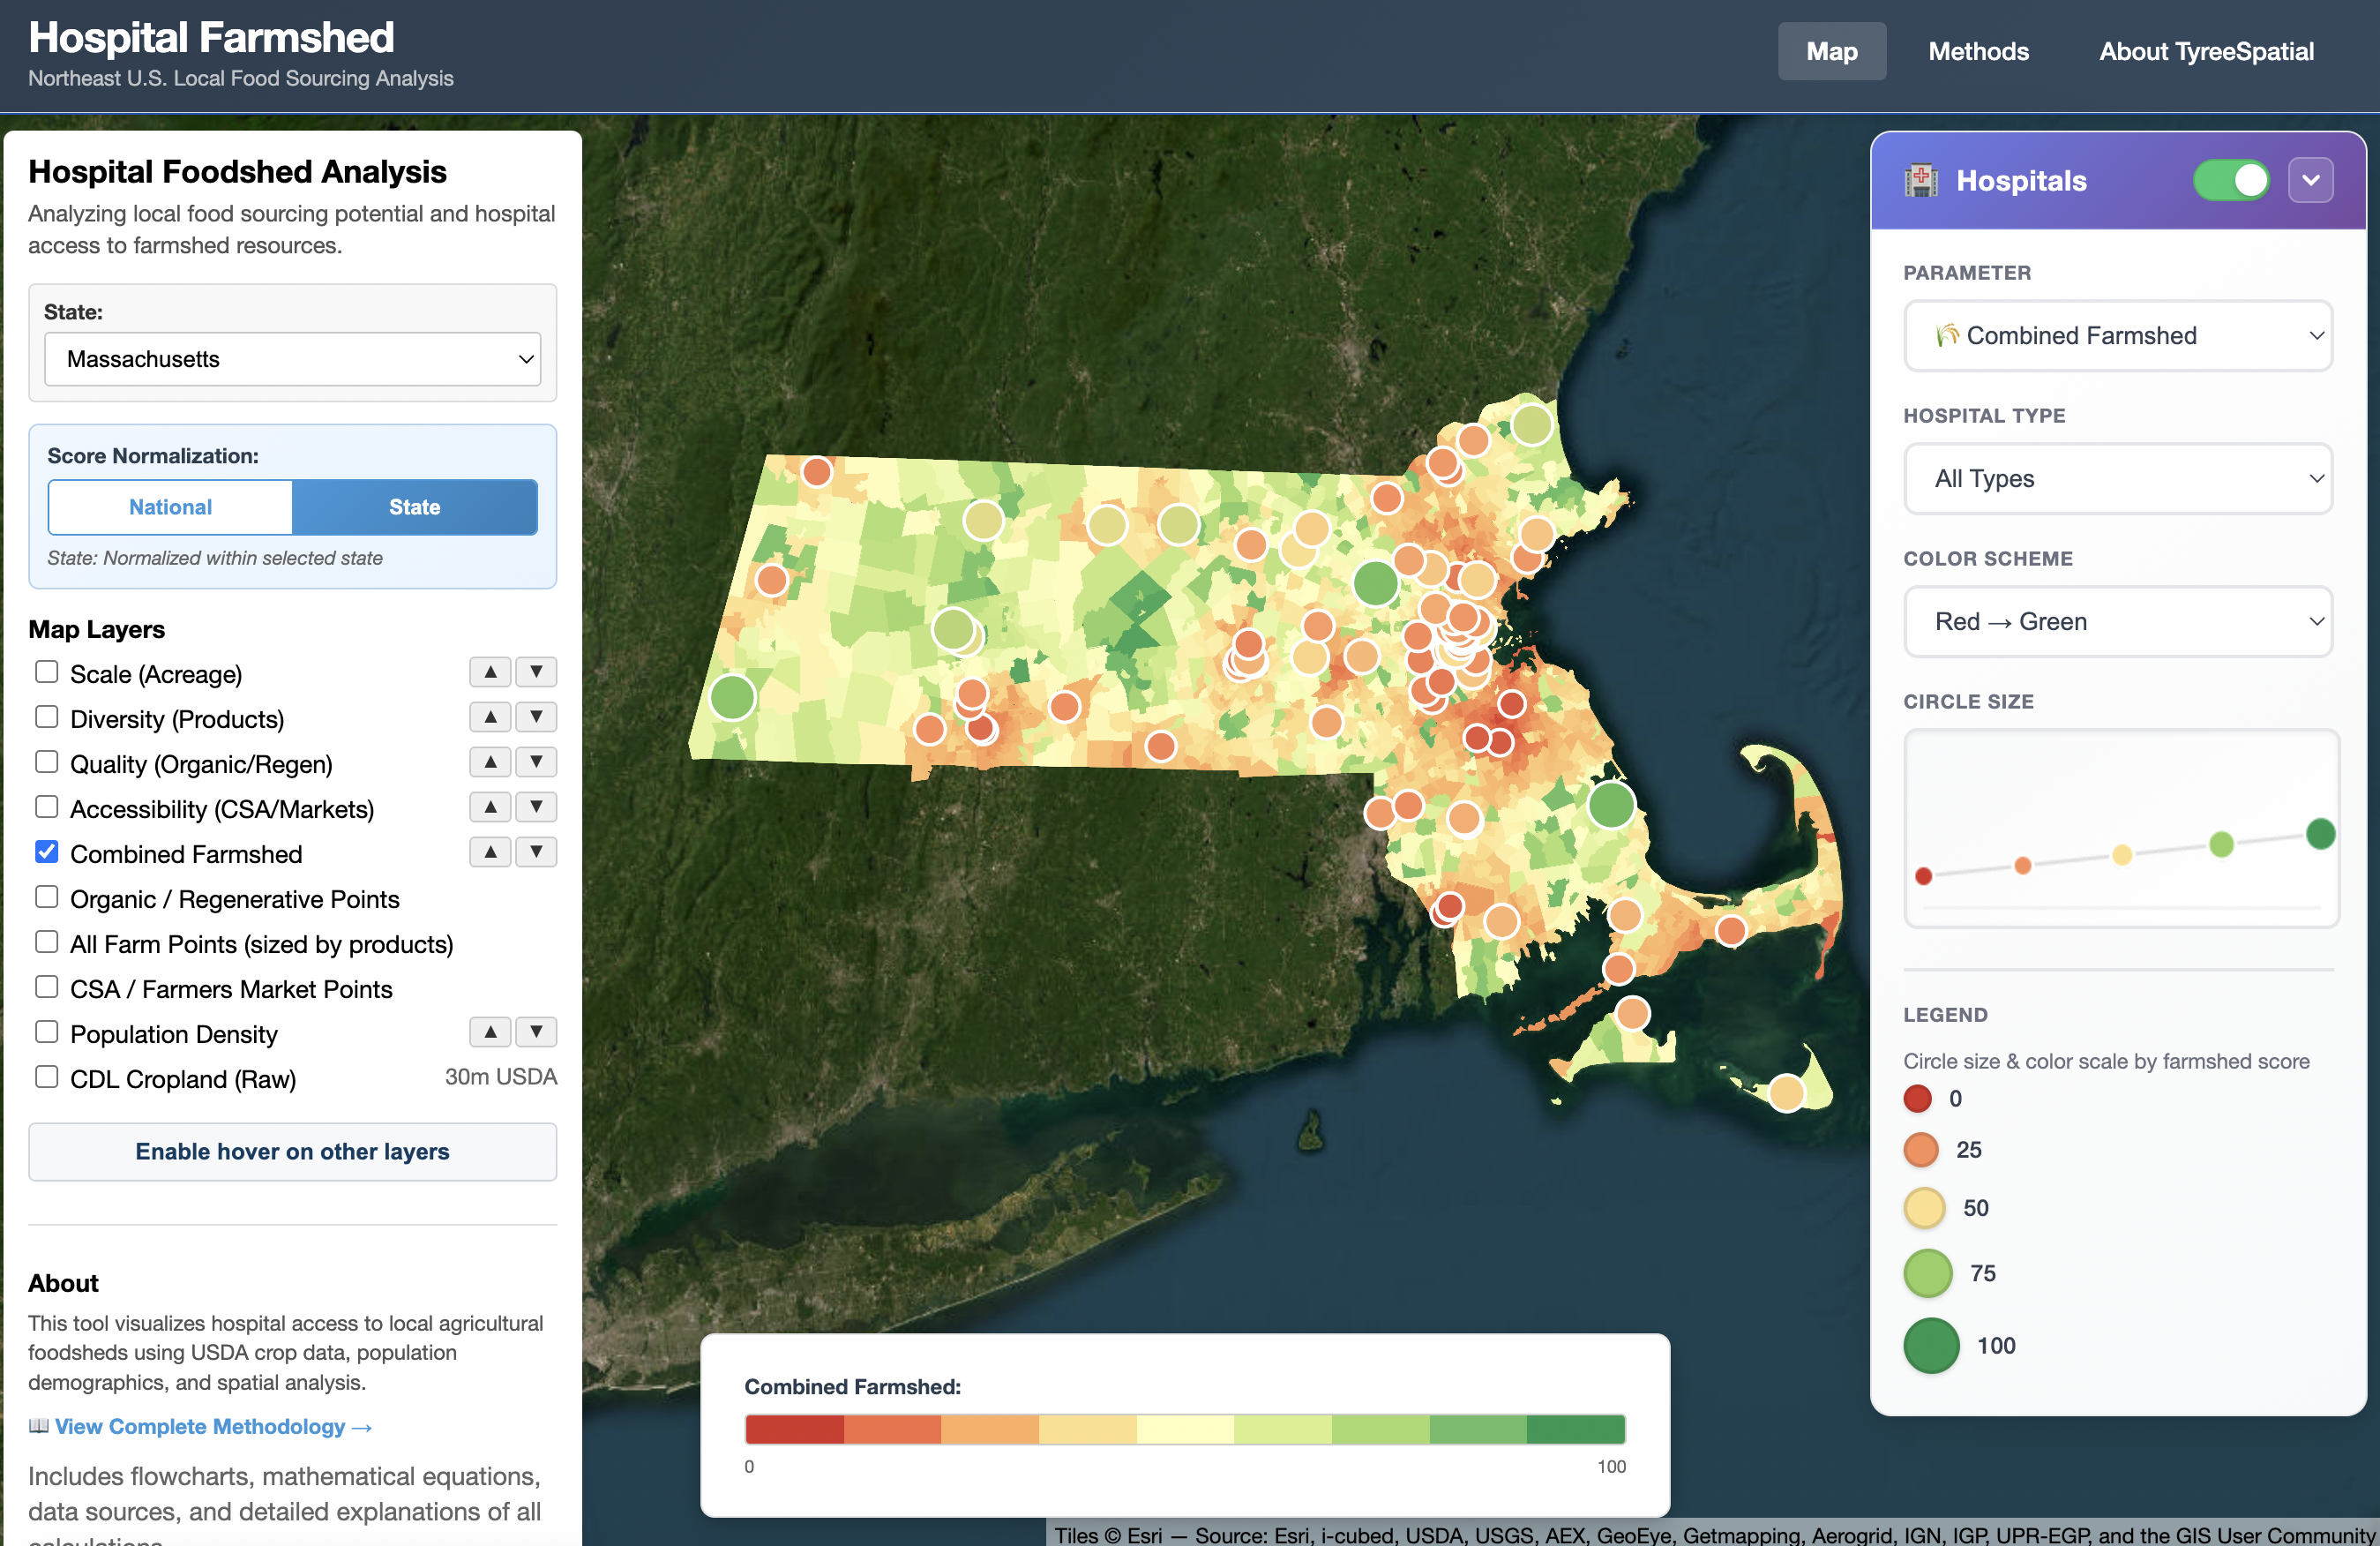
Hospital Farmshed
An agricultural analysis platform that maps local food sourcing potential for healthcare institutions. Calculates multi-dimensional scores measuring Scale, Diversity, Quality, and Accessibility of farms within a hospital's procurement radius.
Visit Site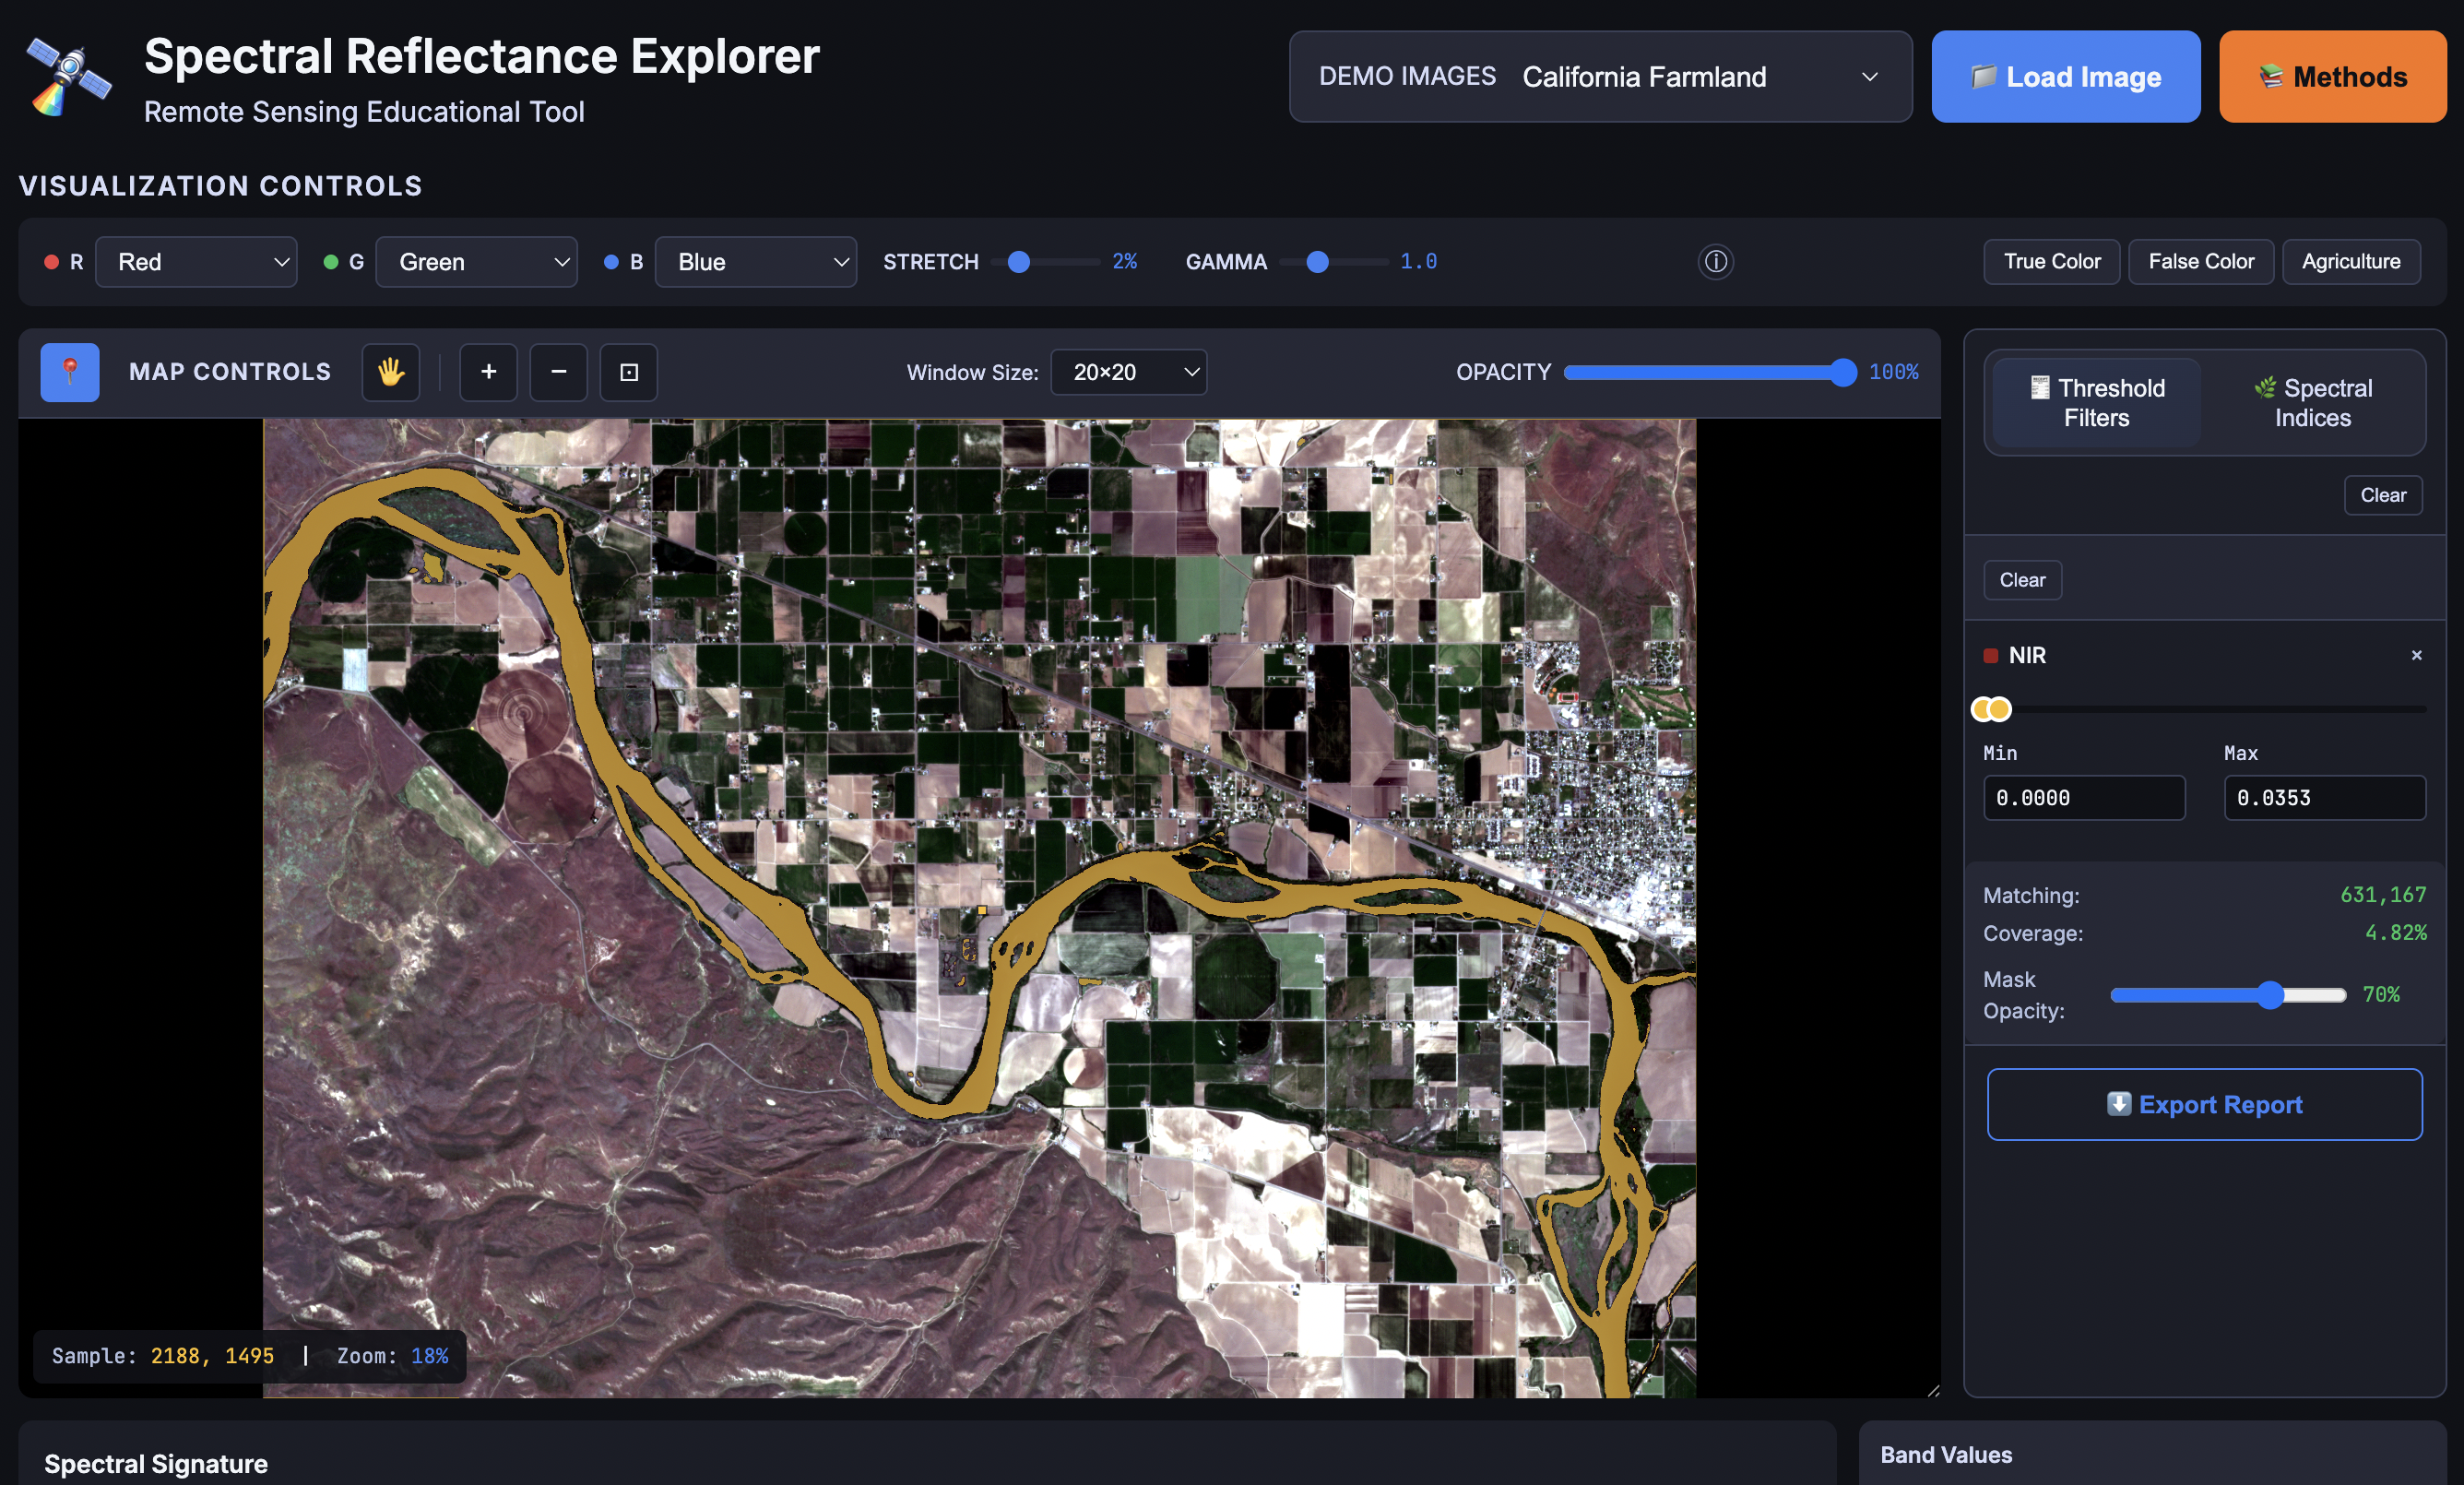
Explore Reflectance
A spectral analysis tool built with Streamlit and Google Earth Engine that allows users to explore how different materials reflect electromagnetic radiation. Compare spectral signatures to understand remote sensing fundamentals.
Visit Site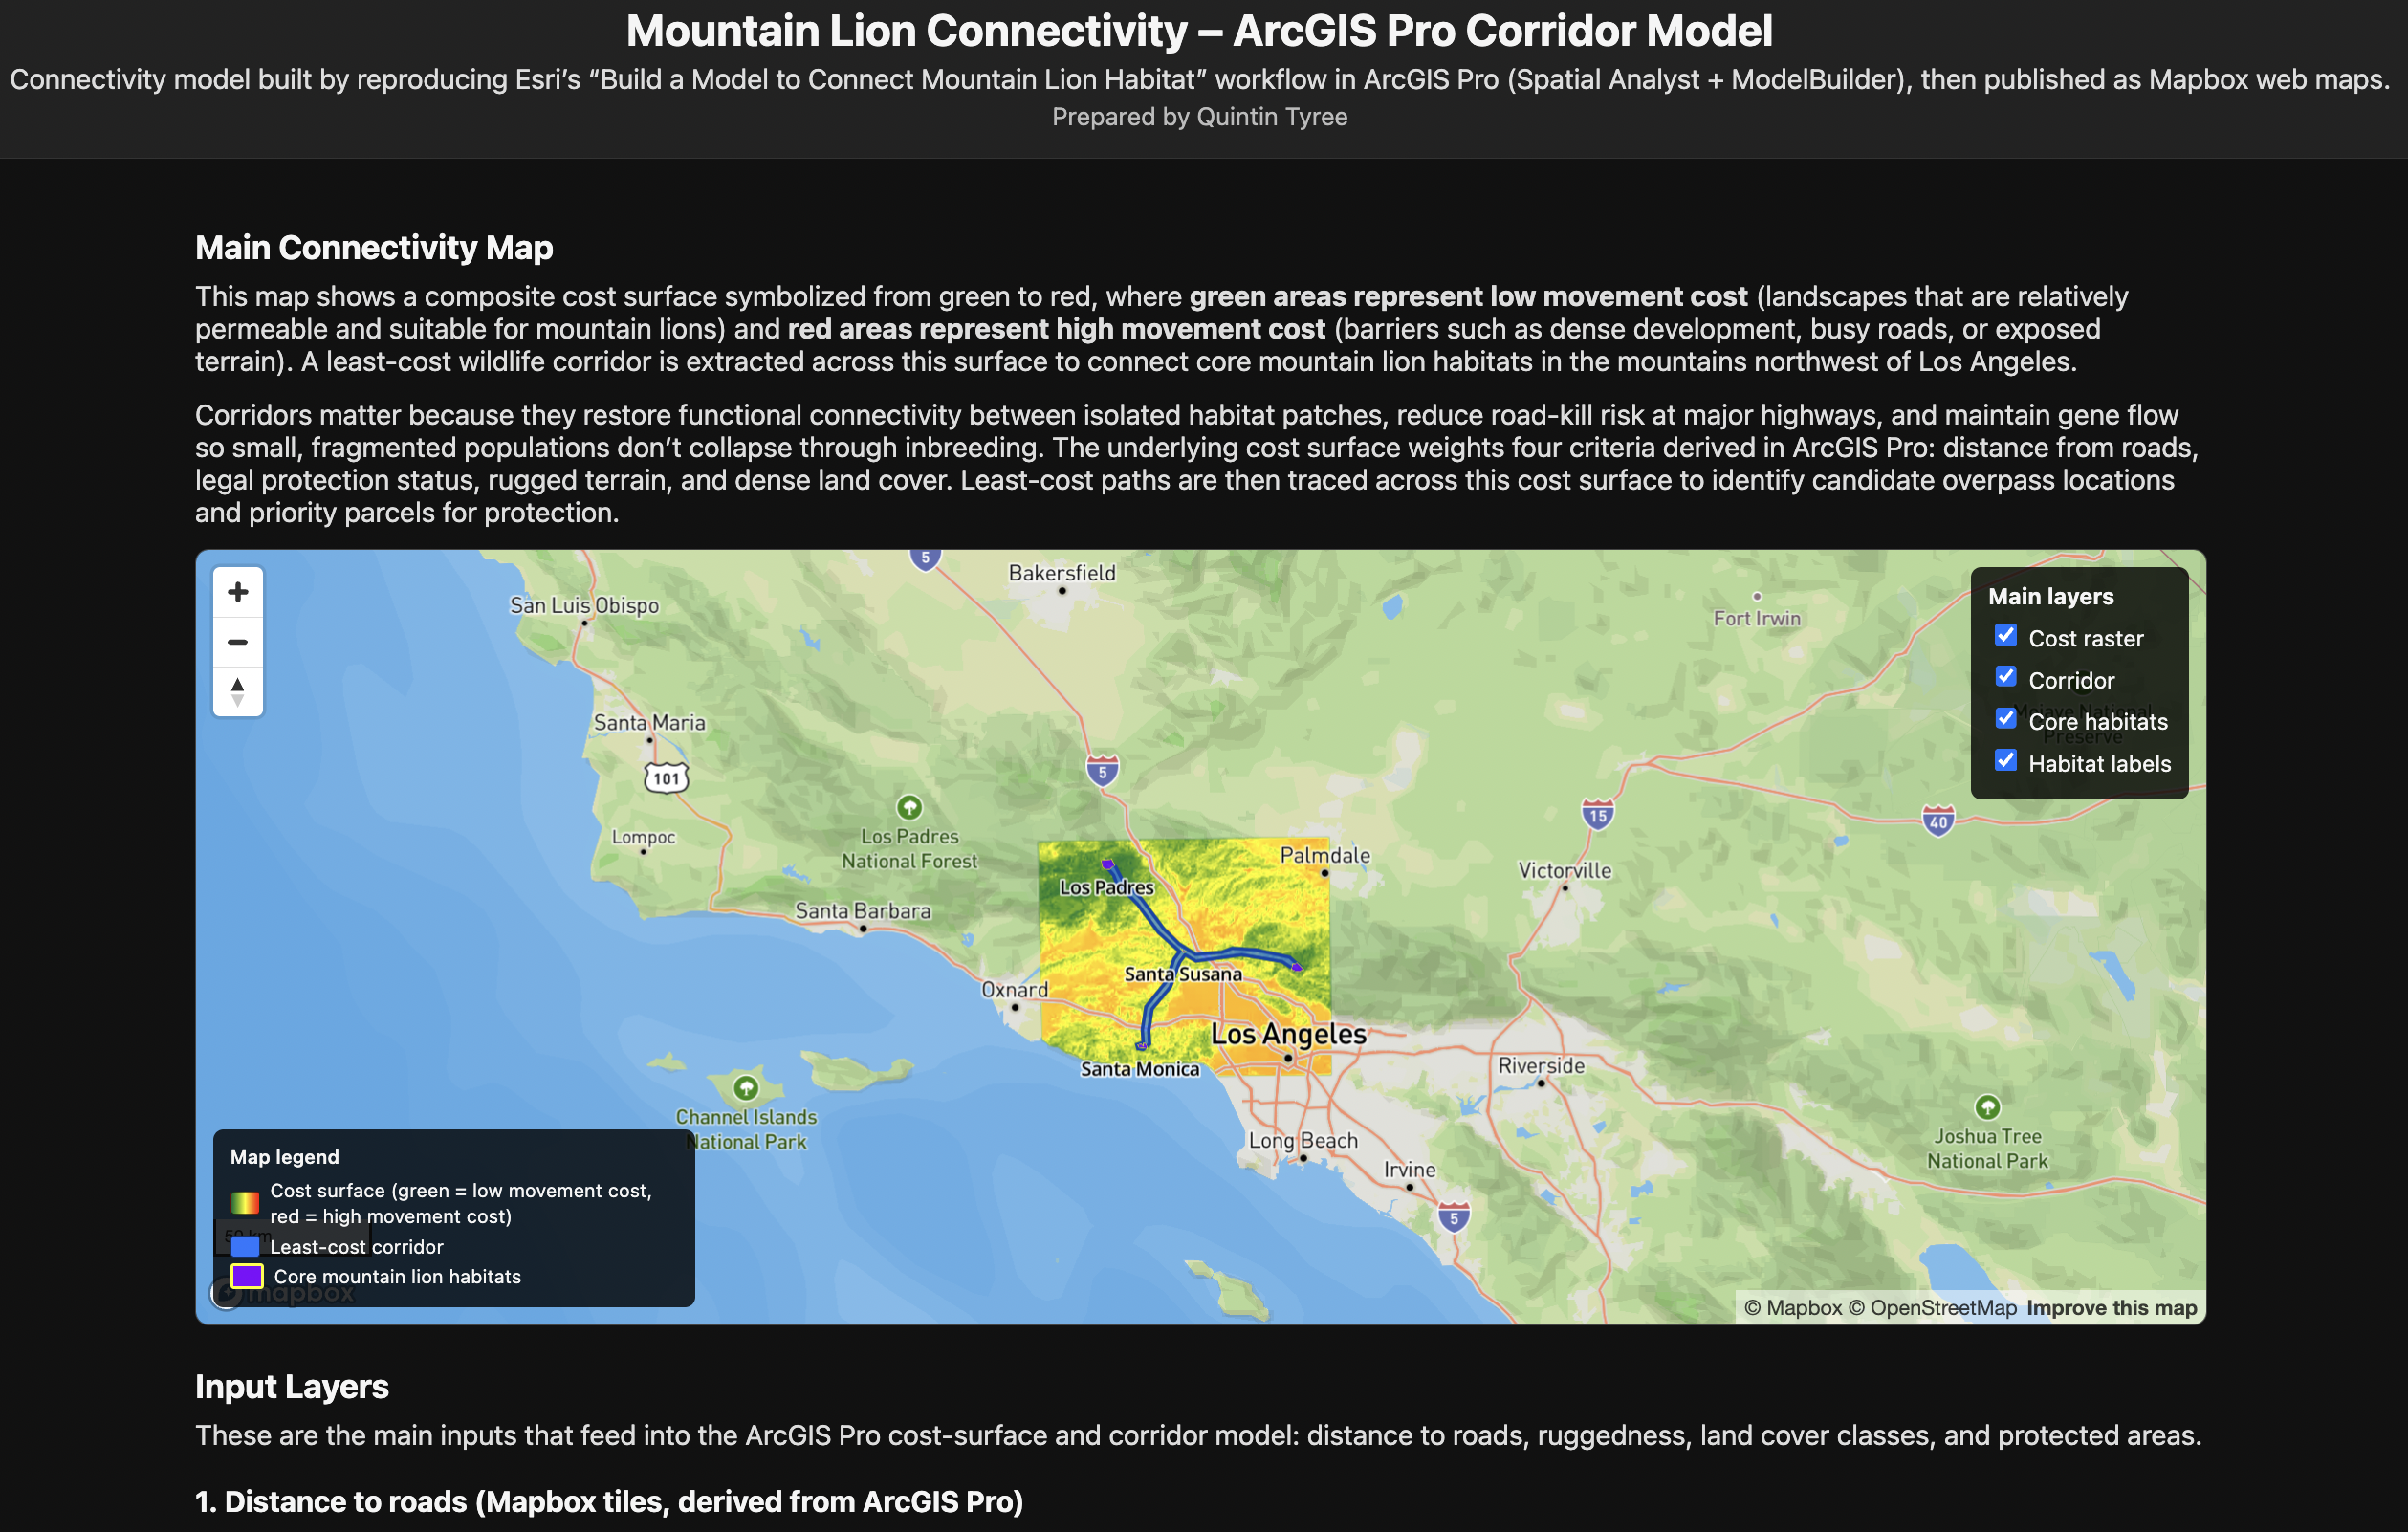
Habitat Connectivity Analysis
An interactive Mapbox application that visualizes wildlife corridor analysis for mountain lion populations. Maps least-cost pathways between habitat patches, identifying critical pinch points where development may fragment wildlife movement.
Visit Site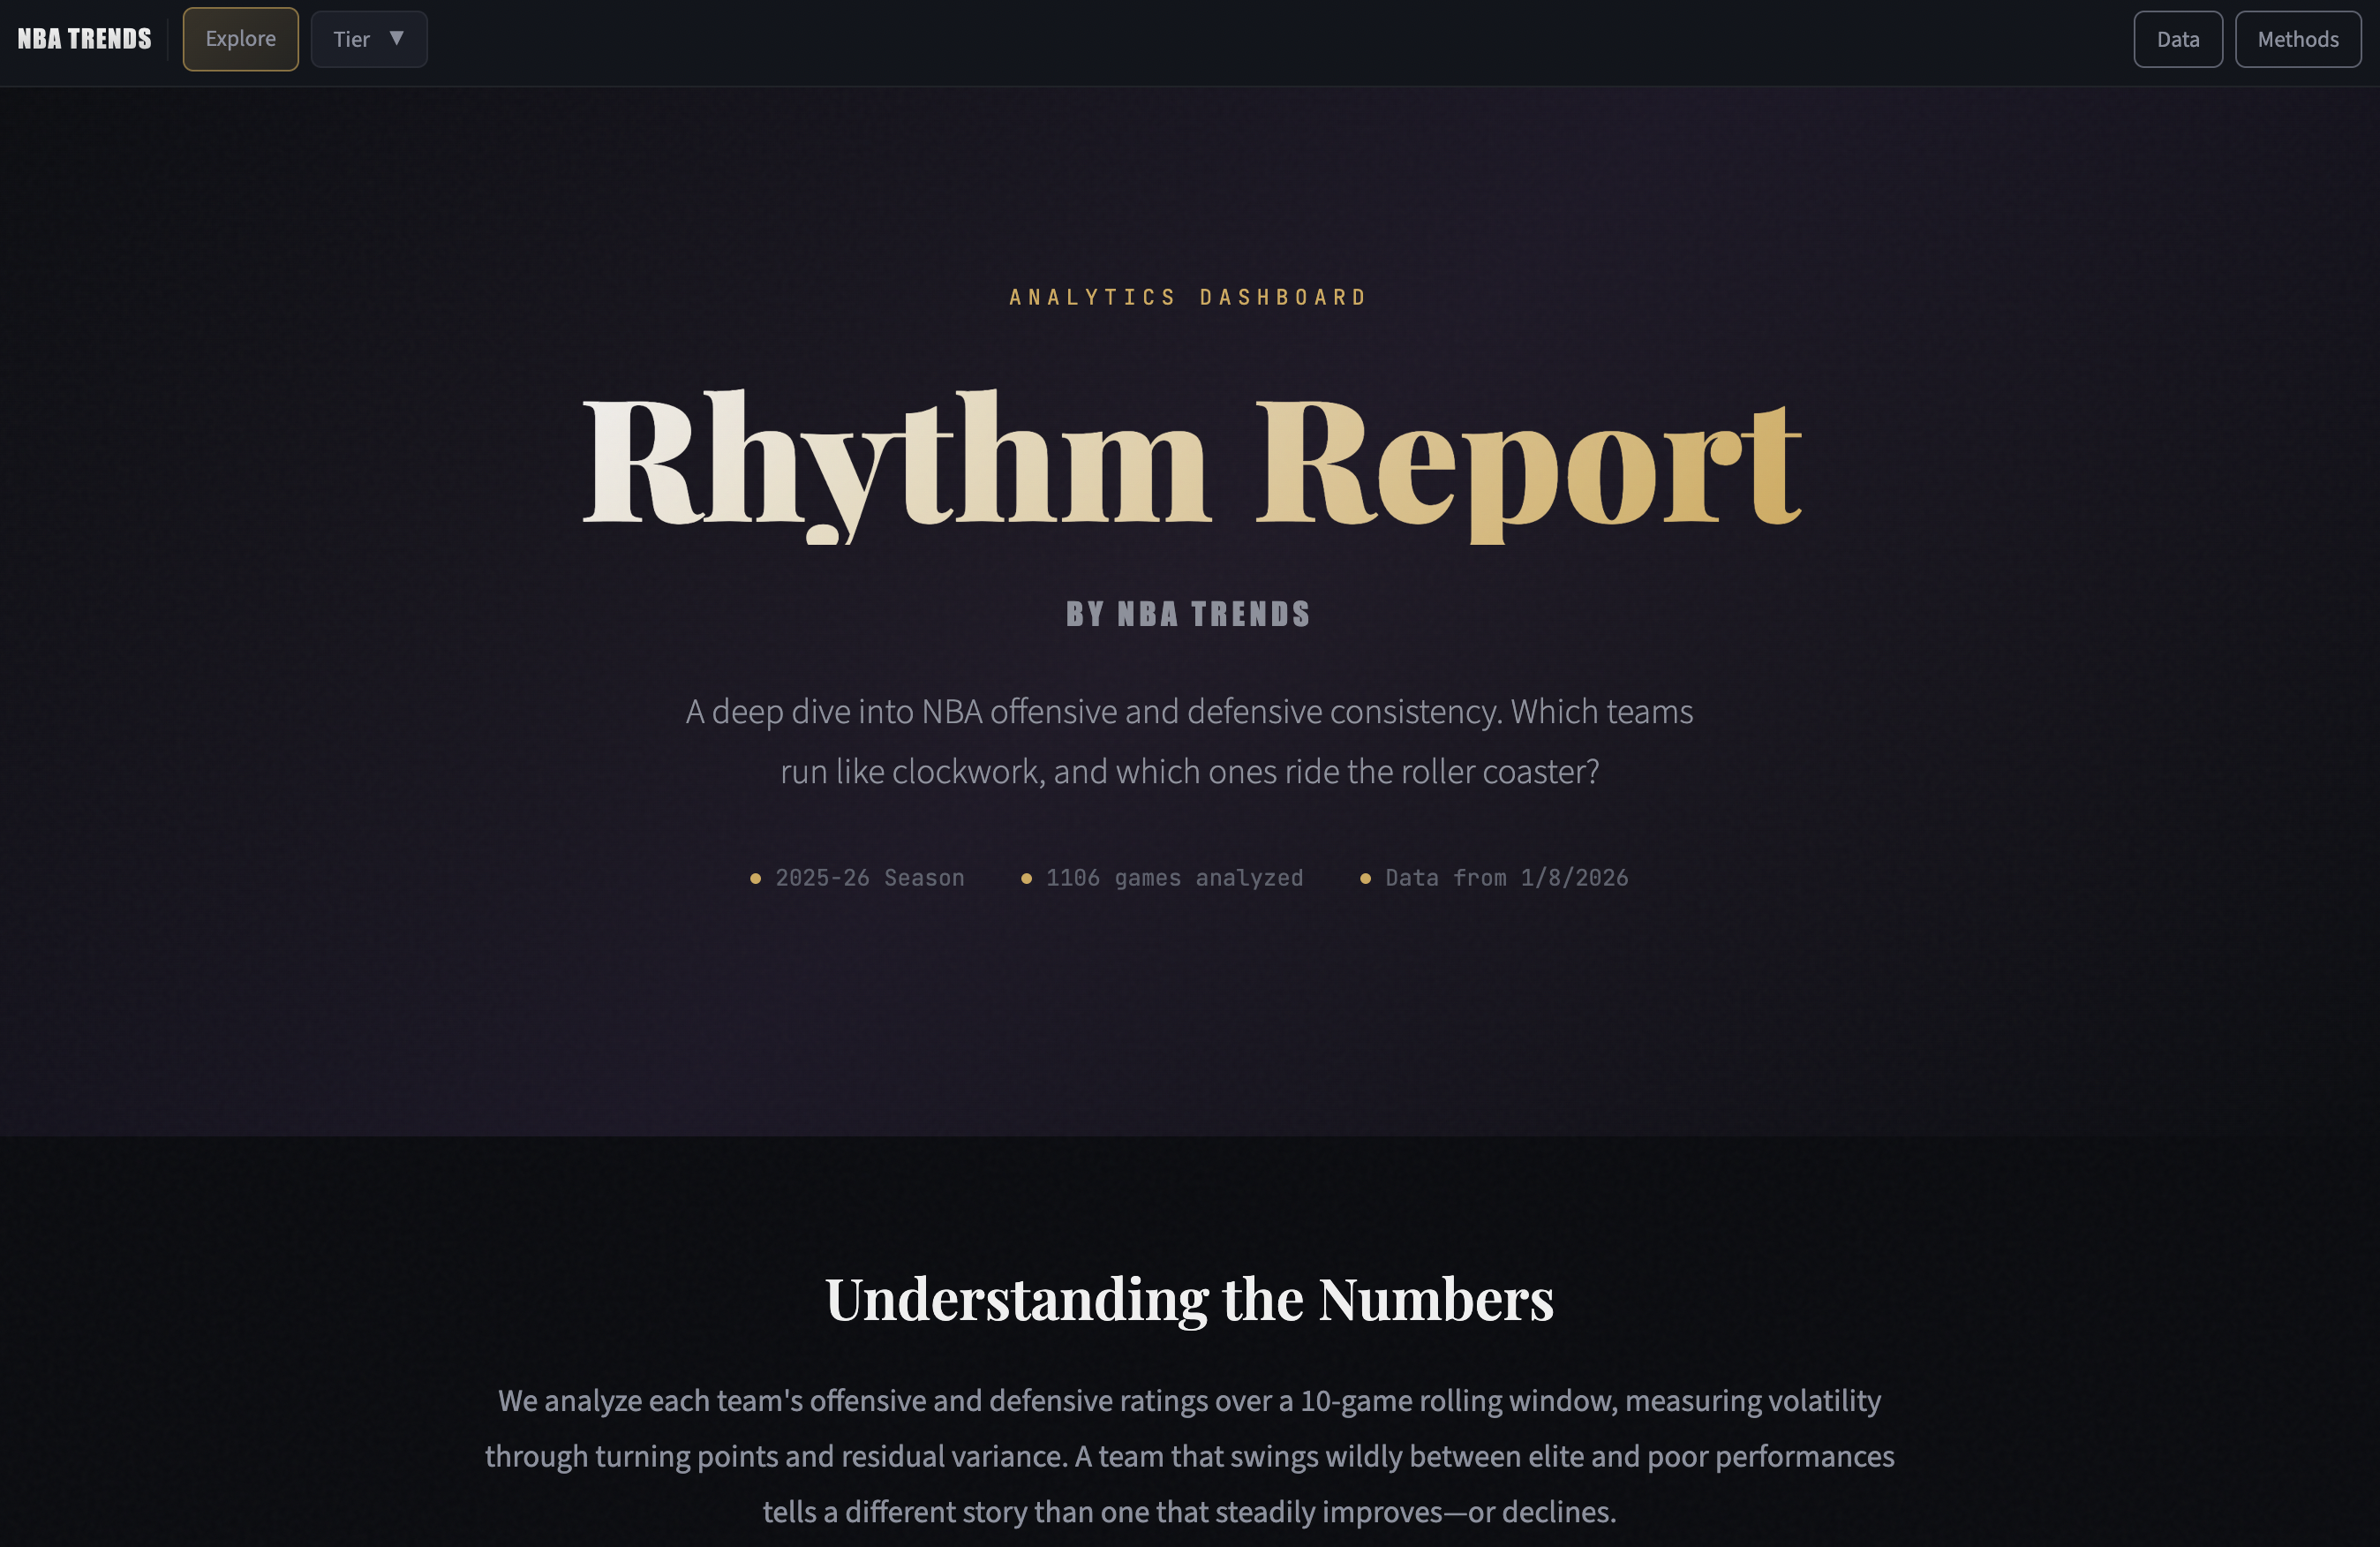
NBA Trends
A sports analytics dashboard that visualizes NBA performance data and trends over time. Interactive charts and comparisons for player stats, team performance, and league-wide patterns.
Visit Site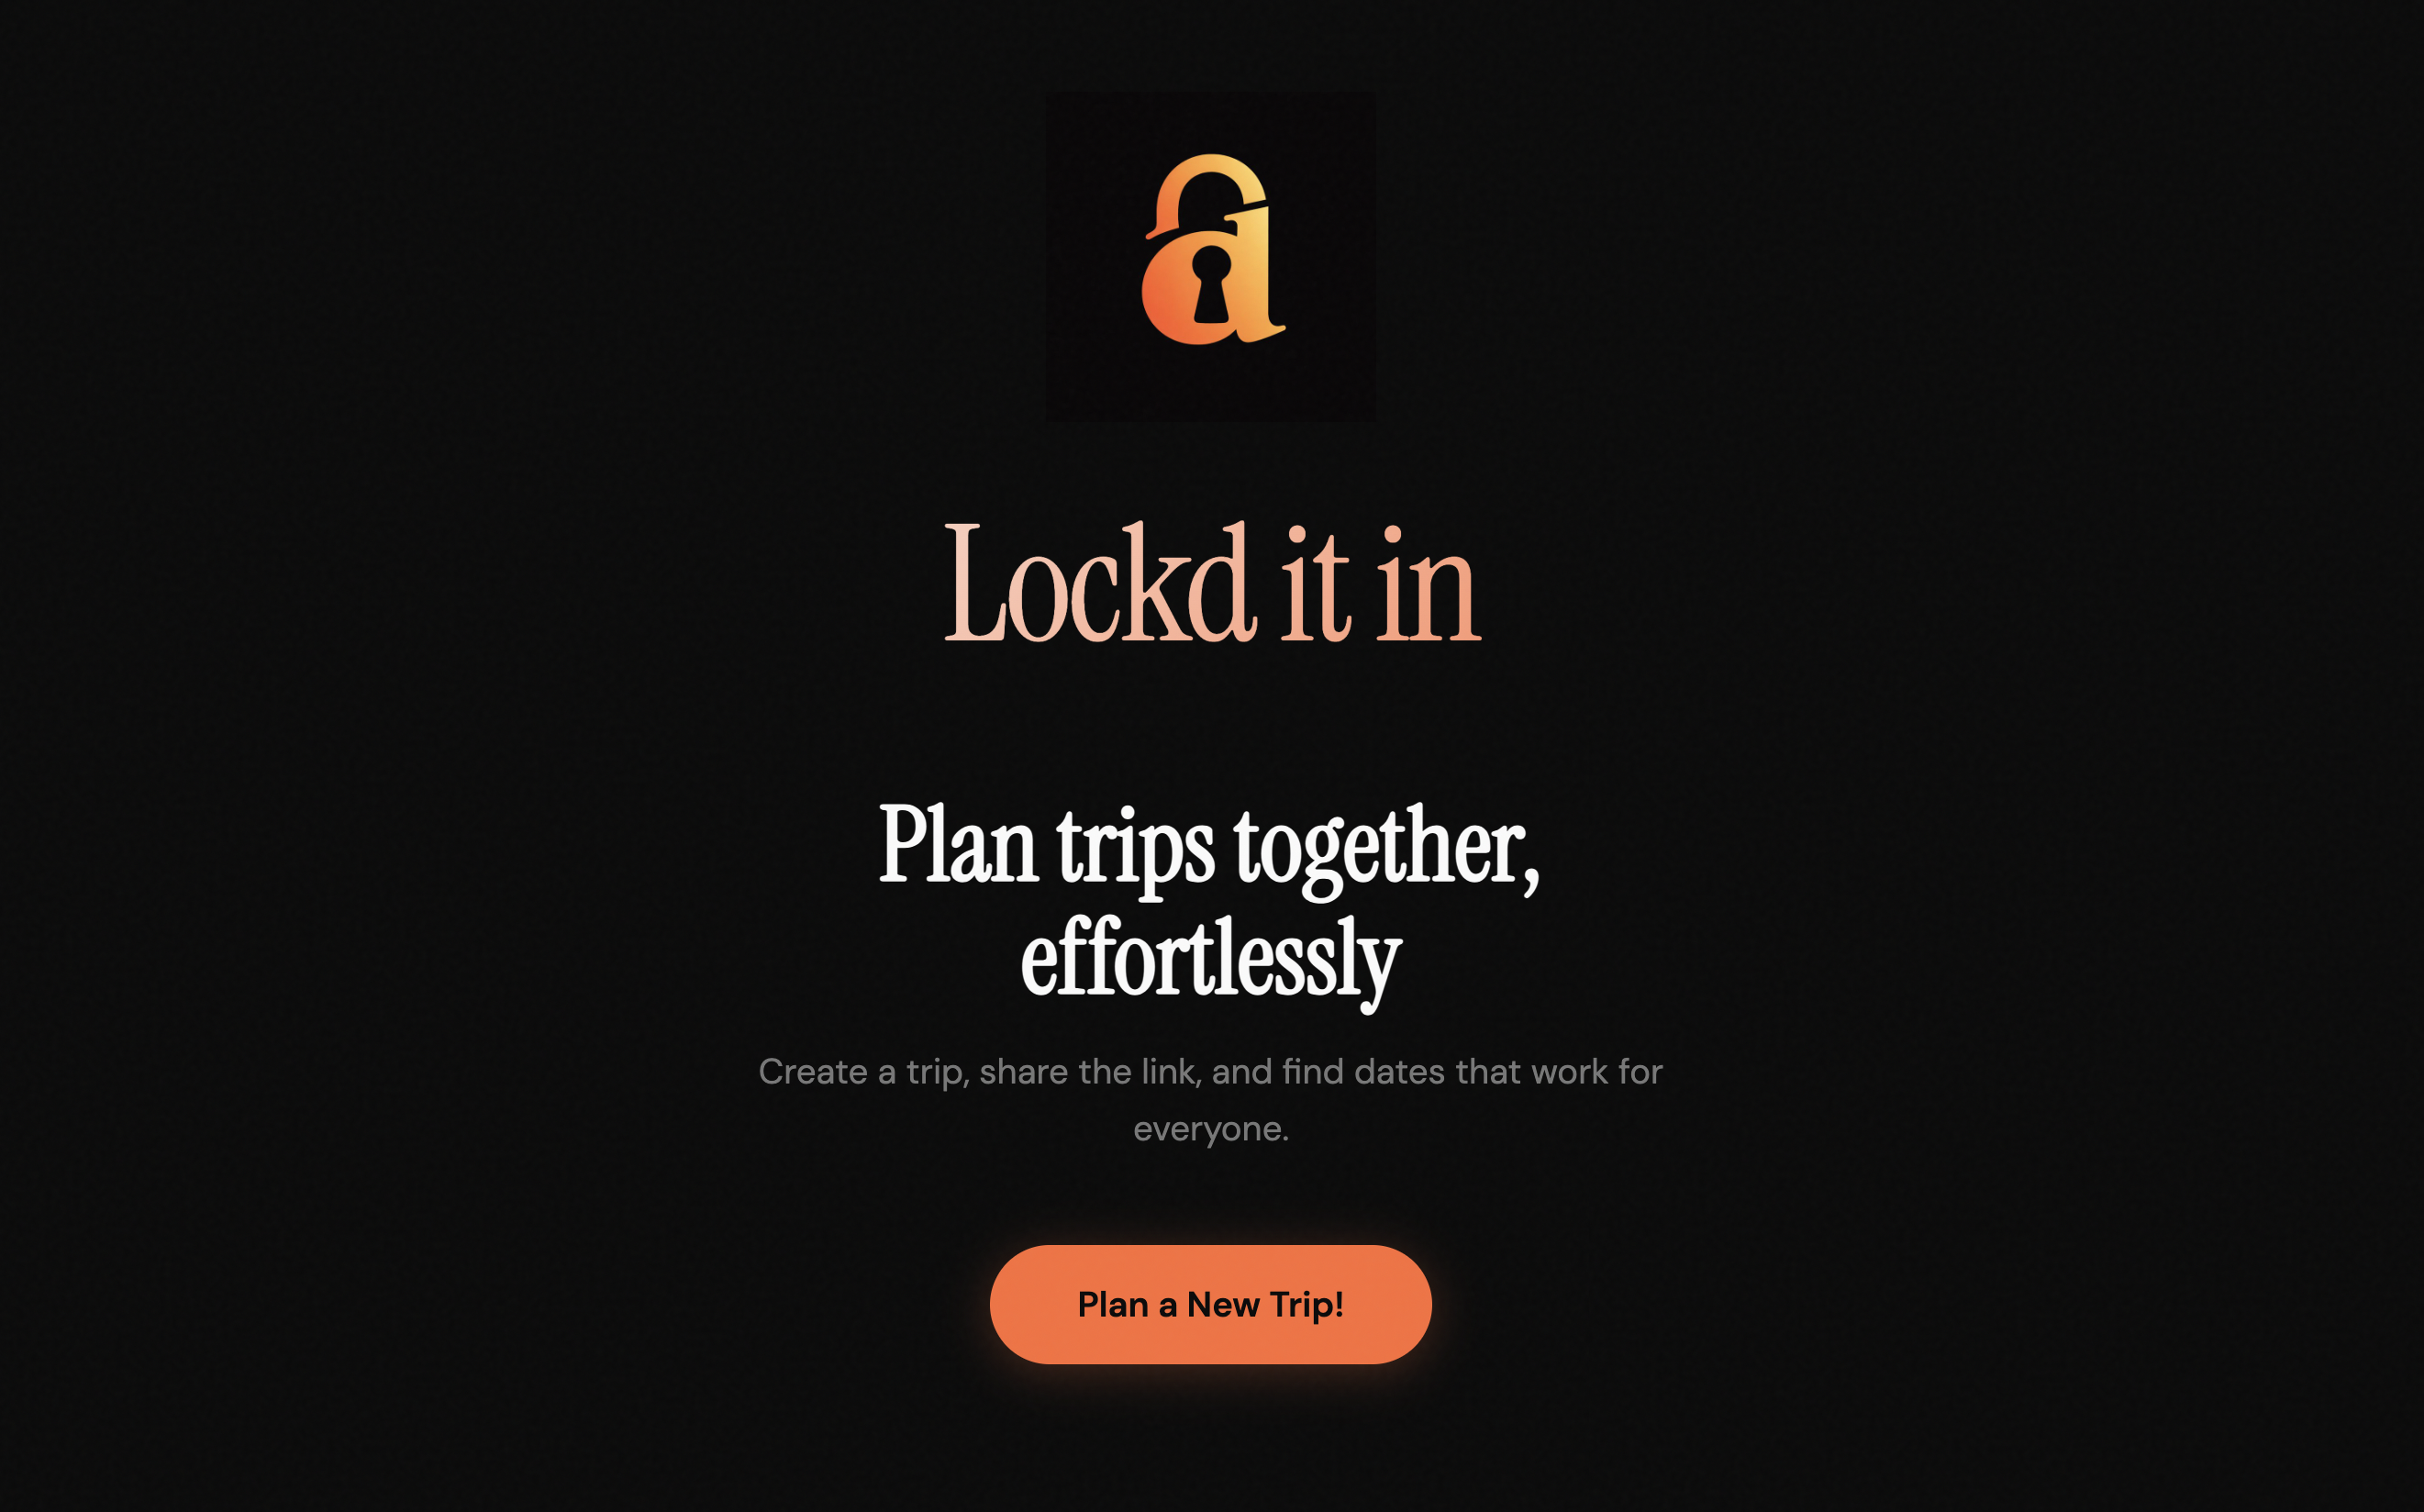
Lock'd It In
A trip planning application that helps users organize and map out travel itineraries. Plan routes, save locations, and share trips with a clean, intuitive interface.
Visit Site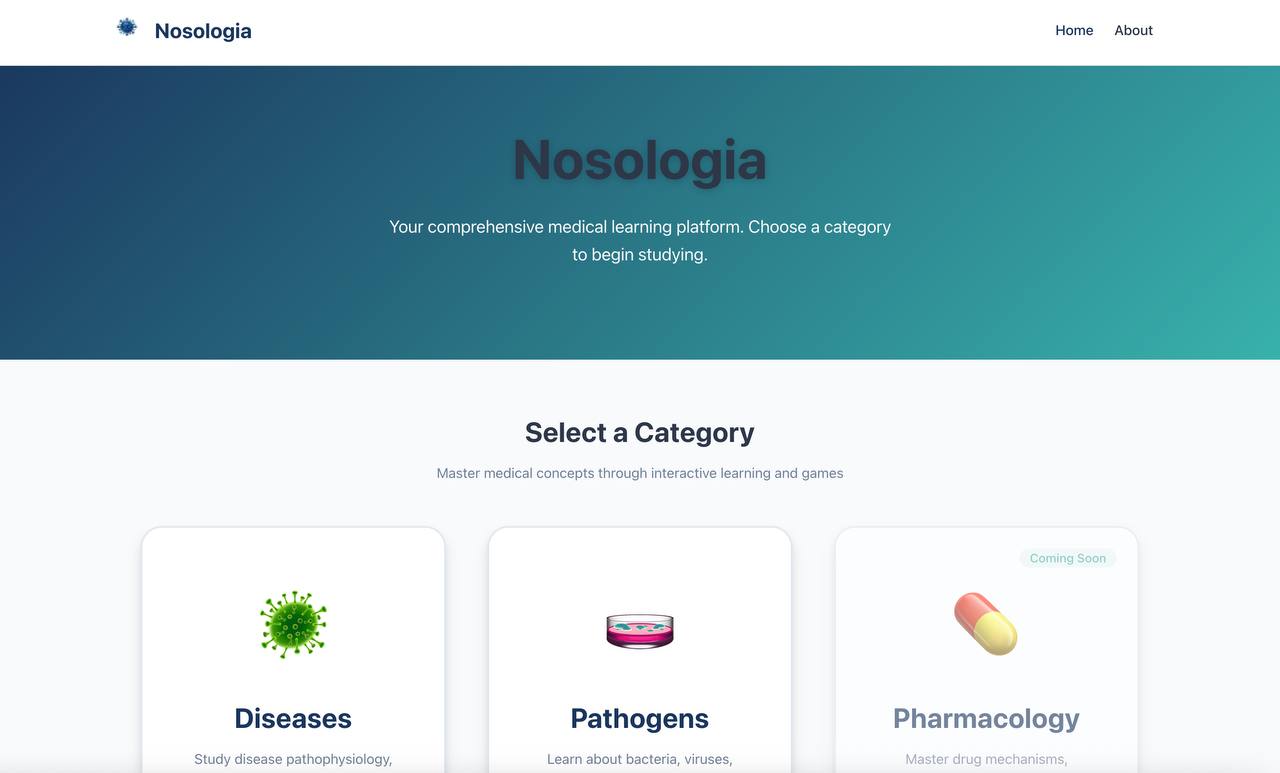
Nosologia
A medical education platform for exploring disease classification systems and nosological frameworks. Helps students and practitioners navigate the taxonomy of diseases and disorders.
Visit Site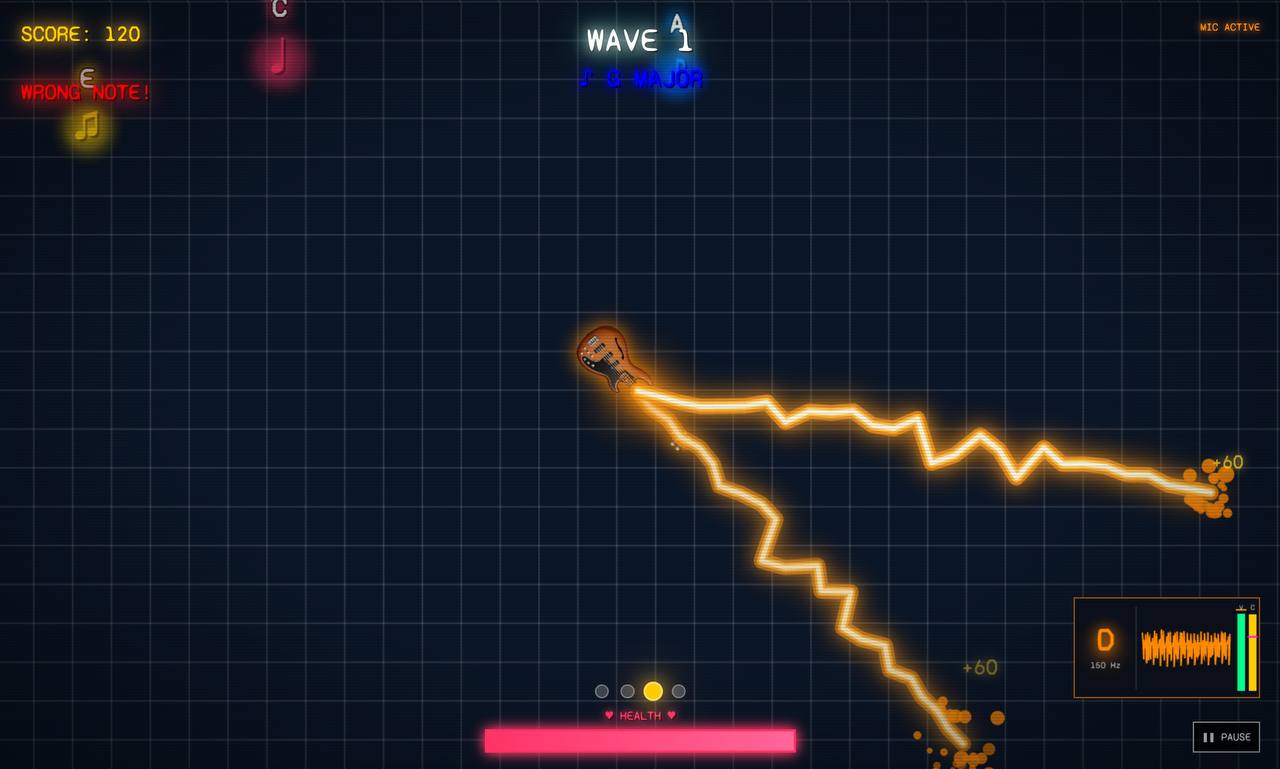
Groove Master
A music practice tool designed to help musicians develop rhythm and timing. Interactive metronome with pattern exercises and progress tracking.
Visit Site