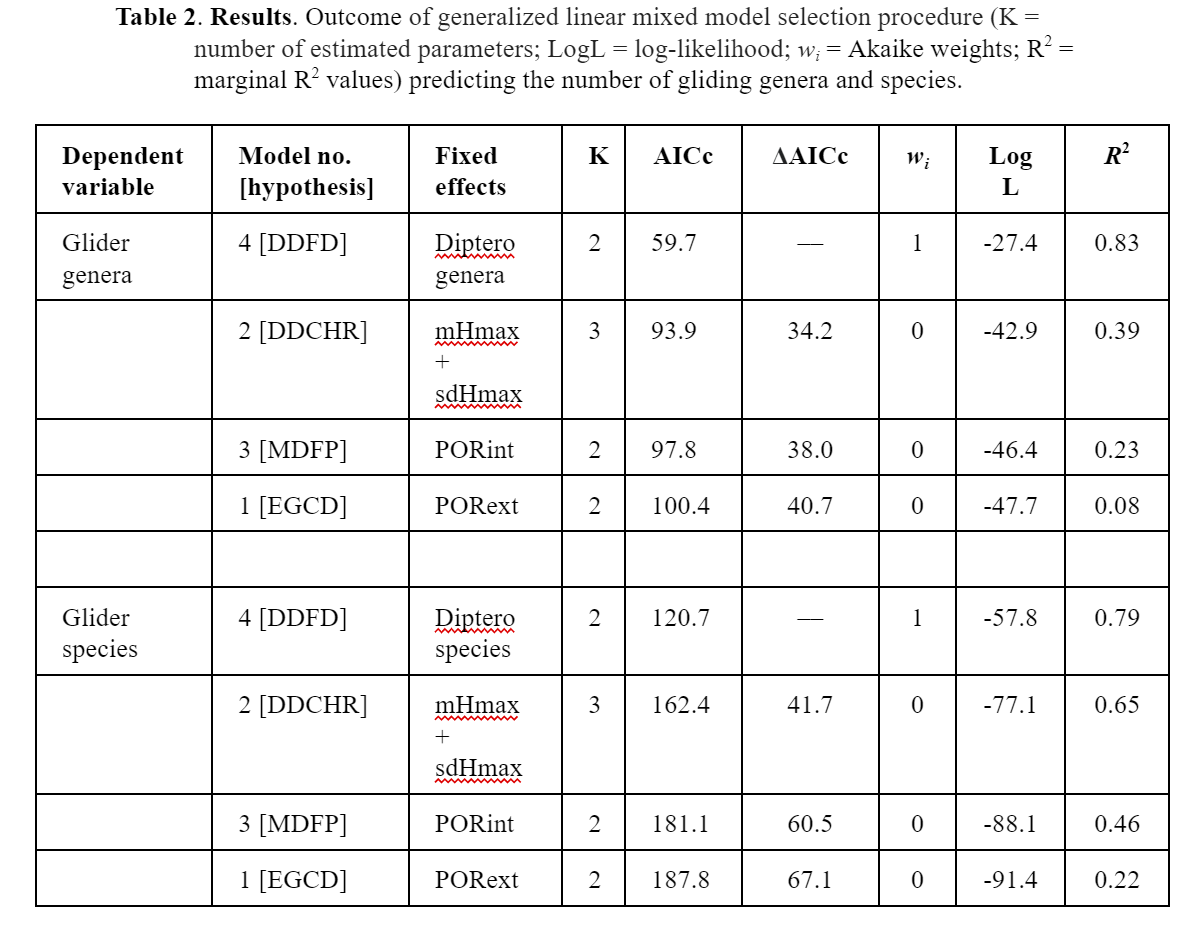
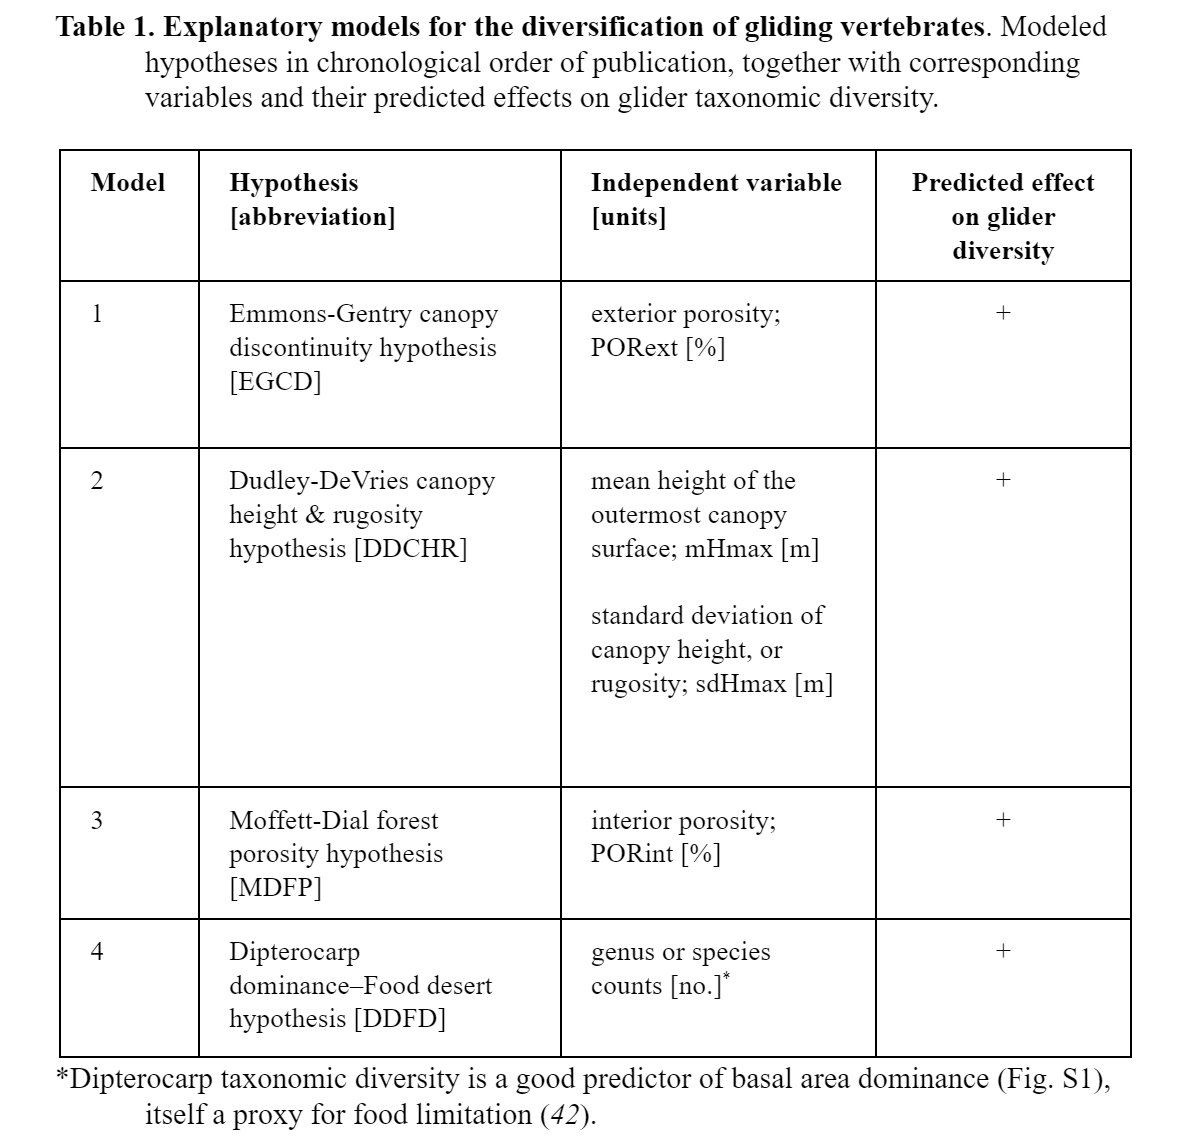
These figures were produced by me for my senior honors thesis at Dartmouth college. This research is on the evolution of gliding in Southeast Asia (submitted to American Naturalist). I generated hotspot maps of glider diversity using >1000 individual species distribution polygons using ArcGIS. Additionally, I discovered and suggested a novel hypothesis and driver of glider distribution and speciation. I accumulated data from many sources- LIDAR data on canopy structure, geospatial data of the distribution and of plant and animal species, Landsat and sentinel imagery, and geospatial data on cyclone density. Finally, I learned to code in R and Python to find a model for the system. Ran a PCA analysis and an AIC analysis.

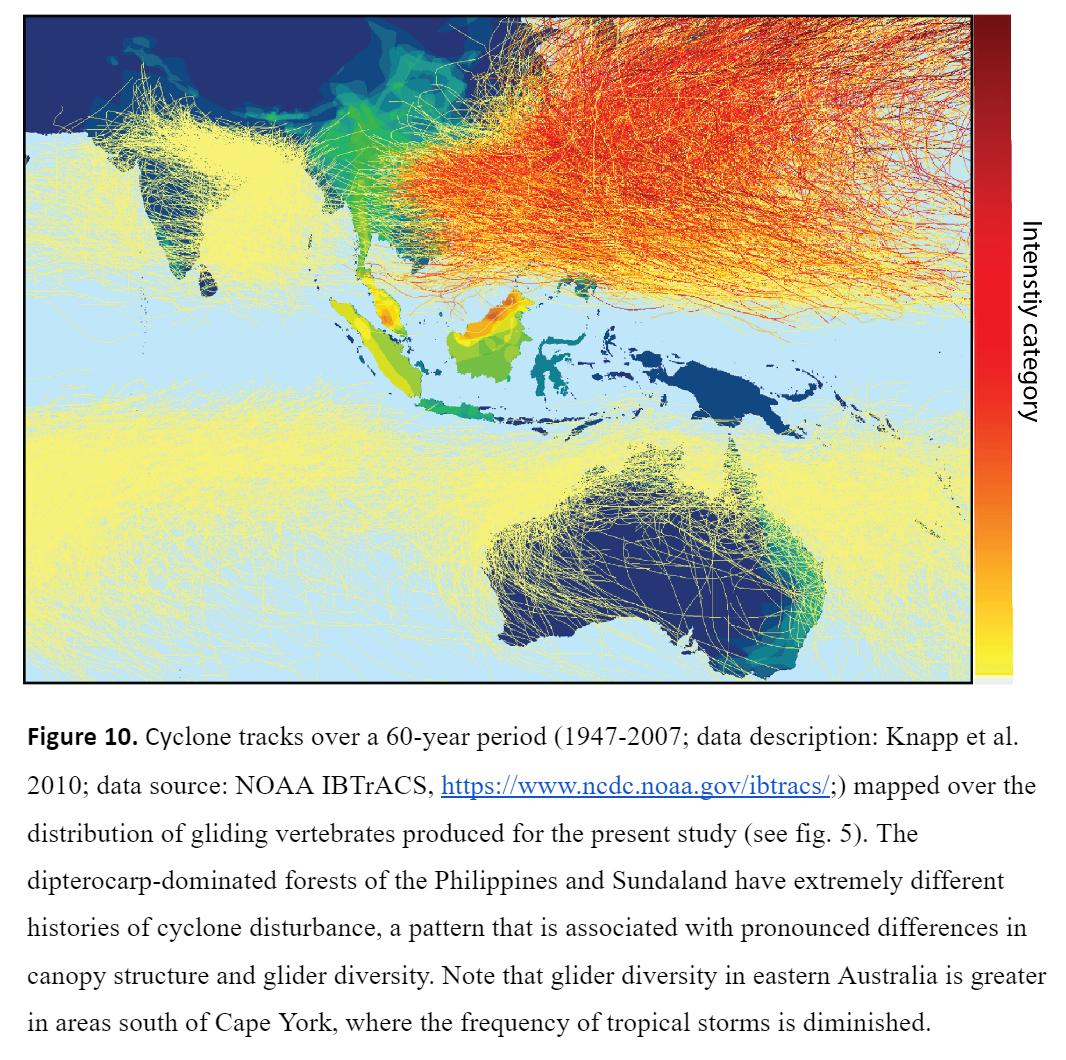
Updated cyclone heat map, showing the hot spots of cyclone activity in Southeast Asia.